Introduction |
|
Today,
there are competitive and compelling reasons to informate businesses. This
desire has led to the emergence of Data Warehousing as an effective
decision-making and business intelligence tool.
The data warehouse marketplace has
definitely moved beyond its infancy. As of last quarter 1998, there were over
one thousand functioning data warehouses in the United States alone.
|
Why do we need a DW at all ? |
|
Companies are being virtually driven
towards data warehousing due to
·
Fierce competition
·
Increasing customer orientation
·
Need for better informed decisions
·
Emerging trends of doing business over large
geographical areas
·
Sheer magnitude of databases in organizations with
the growing maturity of IT
It is said that data in an average organization
doubles every 3 years and only 7% of this is actually analyzed. Corporates
are now realizing they have a tremendous repository of data which they can
analyze for informed decision making.
Going deeper into reasons for the
emergence of DW technology, we find that DW provides
·
Cost Elimination Benefits (mainly the middleman
MIS dept. is eliminated since DW is meant for the end-user - directly)
·
Productivity Enhancements (user can directly query
the DW, can create intuitive and interactive reports to aid the analytical
thought process)
·
Value Added Decision Making (enables end users to
tap information readily and take fast, informed decision so crucial to
maintain the competitive edge today)
|
What is a Data Warehouse ? |
|
According to Bill Inmon, considered to
be the originator of the DW concept,
A Data Warehouse is a
·
Subject oriented (organized according to subject,
not application)
·
Integrated (data residing in separate environments
while moving into the DW acquire consistency and uniformity)
·
Time-variant
(all data in the DW is accurate as of some moment in time, unlike a
transaction processing system, where the data is accurate as of the moment of
access. So DW data is said to be 'time variant'.
·
Non volatile collection of data (data is loaded
into the DW and accessed only there. Once a snapshot of data is made, there
is no data updation during normal transaction processing. Periodic updations
can be done based on requirement)
that supports the Management
Decision-Making Process.
In many ways, the DW is an expression
of information systems's fundamental charter; to collect the organization's
information and make it useful.
So, a Data Warehouse is a
·
REPOSITORY of historical and current data
·
Stored in an ORGANIZED FORMAT
·
Housed CENTRALLY &SEPARATE from
operational/transaction processing systems
·
Used for ANALYTICAL PURPOSES and to support
MANAGEMENT DECISION MAKING
·
Through the use of SEVERAL QUERY TOOLS which allow
random ad-hoc queries so that Users can "Drill Down" to minute
levels of detail
A DW, therefore, is an electronic data
store that CLEANSES and TRANSFORMS data obtained from several sources and in
many forms to a consistent, uniform format so that users can extract what is
relevant to their business needs.
|
Goals/Objectives of building a DW |
|
The fundamental goals of a DW can be
developed by walking around the halls of any large organization and listening
to management talk. The recurring themes heard sound something like this :
"We have mountains of data in
this company but we can't get access to it."
"Nothing drives senior management
crazier than to have two people present the same business results with
different numbers."
"We want to slice and dice the
data every which way."
"Just show me what is
important."
"Everyone knows that some of the
data is not very good."
These concerns are so universal that
they drive the bedrock requirements of a DW.
From the above concerns, we can
identify the
Goals
of a DW
·
Access -
speed, easy to use
·
Data Consistency
- uniform data definitions,
data creation history
·
Data Separation and Combination - slicing and
dicing
·
Query, Analysis and Presentation Tool - RDBMS,
data - 60%, front end query and analysis tools - 40% of the DW hardware space
·
Publishing used data - cleaned, quality assured
data for publishing
·
Driver of Business Re-engineering -
·
To enhance the quality and speed of the decisions
made
·
Translate information into business intelligence
giving
·
An edge over others in a competitive environment
This is achieved by
·
Analyzing business trends
·
making rational forecasting decisions
·
taking product mix decisions
·
identifying core competencies
A classic example is Wal-Mart, the US
based Supermarket chain. With an estimated 1 terabyte of raw data, which is
captured on a regular basis from its stores across the World, the DW of
Wal-Mart holds approx. 65 weeks of historical data, classified by item,
merchandisers, geographies etc. This data is then analyzed to understand
buying patterns, inventory carrying patterns etc. which would have a direct
impact on the cost structure. This in turn helps the company to remain one of
the largest/most profitable chains in the world.
|
The Basic Data Warehouse Environment |
|
·
The Data
Warehouse itself (where data is stored)
·
Source Data
Extraction Module
(to capture the data from OLTP & transfer to DW)
·
User Access
Software
(to query from the DW)
·
Meta Data Repository
Therefore, designers should consider
and understand the unique characteristics and requirements of the three
components
·
The source systems and extract tools
·
The DW Server (RDBMS and Server hardware)
·
The DW access tools
|
Qualities of a robust DW |
|
·
Performance
·
Flexibility
·
User-friendliness
·
Ability to manage huge volumes of information
·
Integrate/interface with existing systems on
heterogeneous platforms
·
The DW Vendor's commitment on product life
·
Possibility of further enhancements
|
Three stages of DW usage |
|
·
As a Query, Reporting and MIS tool
·
As an Analysis, Drill Down and DSS tool
·
As Mining, Predictability, Planning and Business
Intelligence tool
|
Characteristics of a DW |
|
·
Secondary , Offline, Read Only sources of data -
not transaction based
·
Can be populated from existing Internal
operational systems or external data sources
·
Decision Support Systems (DSS) can be directly
built on top of OLTP systems, in which case the operational database acts as
the DW
·
Primarily used for reporting purposes
·
DW is OLAP (Online Analytical Processing) not OLTP
(Online Transaction Processing)
·
Data are organized according to subject NOT
application
For Eg. An Insurance company using a
DW would organize the data by customer, premium, and claim instead of
different products. A typical Insurance company DW would have the data
captured in Insurance policies, Loan transactions, Premiums paid data etc.
which would be classified into customers and subjects. This type of
classification would help the company to analyze which segment of the market
prefers which company offering. The data can then be studied from different
perspectives like geography-wise, product-wise, income category-wise and thus
help design better products according to the needs of the market.
·
It is integrated i.e. data residing in separate
applications in the operational environment acquire CONSISTENCY and
UNIFORMITY
Essentially, what this means is that
as a company grows in size and complexity, the nature of data collected by
the company may vary in terms of structure.
·
It attempts to store current and historical data
for comparison, trends and forecasting and therefore has a time variance
Data in a DW is not volatile as it is
not updated or changed in any way once the data enters the warehouse, but is
loaded and accessed later on.
·
It can be used as a DSS or EIS system and SLICING
and DICING of data
DSS is a system that provides managers
with information they need to make decisions, while EIS is a concise snapshot
of how a company is doing. It allows greater flexibility in slicing and
dicing data and allows exploration of data through multiple dimensions.
|
|
OLTP
|
OLAP
|
|
1. Primary source
of information
2. Online system
3. Inserts,
Updates, Deletes, Selects
4. Data updation
online
5. Different
systems hold different types of data in different formats
6. Data organized
by application
7. Data typically
not integrated
8. Different
naming conventions
9. Different file
formats
10. Different hardware
platforms
11. Recent or
current data(< 90 days) - current values only
12. No time key,
no time series analysis
13. System
resource utilization fairly consistent
|
1. Secondary
source of information
2. Offline system
3. Selects only
(Read only)
4. Data updation
periodic
5. All types of
data are integrated into one system
6. Data organized
by dimensions of the business
7. Data must be
integrated
8. Standard
naming conventions
9. Standard file
formats
10. One Warehouse
Server - logical server
11. Historical
Data (2 - 5 years) - historical snapshots of OLTP data
12. Time Key, Time Series Analysis possible
13. System
resource utilization spiked or uneven
|
Steps in Data Warehousing |
|
A DW implementation can be broadly
divided into
·
Loading
·
Transformation
·
Extraction
Detailed
Steps
1.
Subject
Definition –
determination of which subject will be created and populated in the DW. This
could involve various units such as Finance, Sales, HR or broader
classifications such as customers, products etc.
2.
Data
Acquisition
– refers to the program logic that attaches to the operational data store.
There are a number of languages that can be used for writing programs that
perform data acquisition logic.
3.
Data
Transformation
- are used to convert and summarize operational data into a consistent,
business oriented format, when data is moved into the DW from the operational
environment.
4.
Metadata - To provide
access to the DW, it is necessary to maintain some form of data which
describes the DW. This data about how the data is classified in the DW is
called Metadata. Generating both technical and business metadata is critical
to the DW. Once the metadata is defined, the data is loaded on to the
warehouse structure.
5.
Loading the
Warehouse
- consists of three processes a) Loading the data already archived (b)
Loading of data contained in existing applications and (c) Incremental
changes from the operational environment from the last time the data was
loaded into the DW. As the DW grows, the only scalable solution is the change
data capture. A method must be devised that captures only those data values
that changed since the last DW refresh.
6.
Data
Exploitation
- In the final stage, the data acquired, transformed and loaded is exploited
for decision making. A DW is incomplete until it provides Data Exploitation
Tools that enable end-users to view, analyze and report on data in ways that
support their decision making. It can
be anything to simple query tools and reporting tools to advanced EIS or
OLAP. OLAP enables users to fully realize the business potential of
enterprise-wide data by delivering access to business data organized along
the categories that make sense to the business users. This data is summarized
at many levels of detail and probably most important, has history, allowing
for the examination of trends, both backwards and forwards.
|
Key Technology Components of a DW |
|
Conversion
|
Storage
|
Analysis
|
|
·
Data Extraction
·
Data Scrubbing
·
Data Transformation
·
Data Modelling
|
·
RDBMS
·
Management Tools
·
Catalog/repository
|
·
Managed Query Tools
·
Report Writers
·
Multidimensional Analysis Tools
·
Multidimensional Database Servers
·
Relational Online Analytical Processing Tools
(ROLAP)
·
Data Mining Tools
·
Data Visualization Tools
·
Executive Information Systems
·
Vertical Applications
·
Horizontal Applications
·
Internet Enabling Tools
|
|
Glass House
|
DBA and Designer
|
End-user/Decision Maker
|
Data Marts |
|
A
Data Mart is information pertaining to a smaller department or line of
business or a product within an organization, while a DW is a sum total of
these smaller data marts or departments in an organization. So vendors are
going for a bottoms-up approach of starting off projects with smaller data
marts. The average cost of a departmental data mart is anywhere between Rs.30
lakhs to Rs. 40 lakhs as opposed to a full fledged DW which costs upwards of
Rs. 1 Crore. Besides, an organization can get results on investment of a data
mart even before the project is completed. Justifying this is a 1997 study
published by International Data Corporation, describing 62 companies of all
sizes and in different industry segments that had implemented a DW solution.
The results of the Study revealed a mean ROI of 400%. While companies which
implemented Data Marts showed an average ROI of 600%.
|
Data Mining |
|
Data Mining is the operation of
digging out critical data from within an organization's stored information
for better decision support. It goes one step beyond data warehousing. Data
Mining or Knowledge Discovery in Databases (KDD), as it is also called, is
defined as
·
The non-trivial extraction of implicit, previously
unknown and potentially useful information from data.
While a DW helps in analysis, data
mining enables
·
clustering of data
·
data summarization
·
learning classification rules
·
finding dependency networks
·
analyzing changes and detecting anomalies
Data Mining identifies and
characterizes inter-relationships among multi-variable dimensions analyzed
single dimension at a time.
Steps in the Data Mining Process
·
Selection
·
Preprocessing
·
Transformation
·
Data Mining
·
Interpretation
·
Evaluation
Some
techniques used in data mining
·
Associations
·
Affinity Tables
·
Segmentation or Clustering
·
Modeling
·
Visualization
|
Multidimensional models |
Dimensions
·
Organize data by the primary lines of business -
called Dimensions in DW parlance. For example a Retail model will present all
the necessary facts and measures by store, product and time - the 3
dimensions of the business
·
Users analyze the data by manipulating a dimension
without changing the criteria for any other dimension
·
Within each dimension, the user can decide the
level of aggregation for a report
·
Allow multidimensional analysis
Attributes
A Dimension consists of one or more
Attributes i.e. it is
·
A logical grouping of elements or items within a
dimension i.e. Levels within a Dimension
·
Categories or classes of elements that have the
same logical level within a dimension
Attribute Functionality/Purpose
·
Allows users to define aggregation level for data
·
Allows users to present data grouped by one or
more attributes
Attribute Relationship Rules
Attributes within a dimension are
·
directly related to each other through
relationship tables
·
indirectly related through other attributes within
the same dimension
Attributes in different dimensions are
·
directly related to each other only through a Fact
or an intersection of dimension
Facts
Facts are data necessary for business
analysis, means of monitoring business performance key business factors. They
are basically business measurements, data, and variables. They are all put
into Fact Tables.
Facts are of two types
·
Raw or Base Fact (fact metric)
·
Derived or calculated metric (compound metric)
Base Facts
·
Will exist as columns in Fact Tables
·
Will come from different source systems
·
May have diff. Levels of granularity (eg. Sales
tracked by day, stocks tracked by week)
If some facts are independent of
dimension,
·
They are not keyed by that dimension
·
They require a separate fact table with different
key structures
Derived or Calculated Metrics
·
Built from one or more base metrics (eg.
Sales$/sales units = Avg SP)
·
Can handle only very simple arithmetical
calculations
|
Mapping Logical Model to Physical Schema |
|
A Schema is
·
a diagrammatic representation of the structure or
framework of something
·
a logical and physical definition of data
elements, physical characteristics and inter-relationships
Examples of Schemas - Tables, Views,
Synonyms, Sequences, Snapshots, Indexes
Components
of a Table (Schema)
·
Table Structures
- table names, column names, column data types
·
Primary Key definitions
·
Foreign Key definitions
Others
·
Source system feeds
·
Refresh and update memory
·
Primary and secondary index definitions
Schema (Table) Building Process
·
Construct Table Definitions for all components of
the Dimensional model including attributes, relationships and metrics
·
Examine strategies for optimizing performance
·
Take into account source system feeds, data
refresh & update frequency, usage profiles
Table Types
·
Lookup tables - contain ID columns and DESC col.
(if any) of attributes
·
Relationship Tables - contain ID columns of 2 or
more attributes defining associations between them
·
Fact Tables -
contain fact columns & attribute ID columns, thereby defining
ssociations between them
Columns
Columns are fields holding attribute
and fact data within tables
·
Attributes and metrics correspond to columns
·
Attribute elements and metric values correspond to
rows within columns
Column Types
Attribute ID Columns
·
Contain attribute element identification codes
·
Are reqd. for all attributes
·
Are typically and preferably numeric (processed
more rapidly than text)
Attribute Desc. Columns
·
Contains attribute element's text desc.
·
Are optional for all attributes
Fact Column
·
Are numeric
·
Are usually additive in nature
·
Contain business performance data - eg. - sales,
inventory, revenue
Combined Lookup/Relationship Tables
·
Combining tables is done to optimize query
performance by minimising table joins
·
Multiple parental relationships may be defined ina
single lookup table to reduce table joins further
·
Parent-child relationship should always be
included in child lookup tables unless the concerned relationship is many to
many, in which case, a separate distinct relationship table must exist.
Creating Fact Tables
·
For each set of facts, a fact table is reqd.
·
Fact tables contain one attribute key for each
relevant dimension
·
One column for each fact or metric
Fact tables consist of
·
Data columns and attribute keys which
·
Define the level of data and the relevant
dimensions
Fact
Table Keys
·
Primary Key (PK) of the fact table will be
compound and composed of the attribute key
·
Each attribute key is a foreign key referencing
the PK of the attribute's lookup table
|
|
Basic
Normalized Schema
|
|
·
Consists of one or more lookup tables (for one or
more attributes) per dimension
·
Lookup tables must hold all the information for the
attributes in that dimension
·
Fact tables will exist at the intersection of the
dimension lookup tables
·
Fact table will typically be the largest table in
the DW
Schema Characteristics
·
Fully supports multi-dimensional reporting
·
Fully normalized - smallest tables, no redundant
data
·
Each attribute has only one lookup table
·
Queries including higher level attributes will
contain more joins
|
|
Basic
Denormalized Strategies
|
|
·
Higher level attribute information( eg. For
period, year, region, dept) is denormalized (included in) down to the lower
level attribute lookup table
·
No. of joins will be reduced
·
Shows only lowest level attribute lookups
Schema Characteristics
·
Fully supports multi-dimensional reporting
·
Unique lookups for only lowest level attributes
·
No. of joins in the average query minimized
·
Size of the lower level lookup tables increase
with the addition of higher level attribute information
|
|
Logical Data Model (LDM)
|
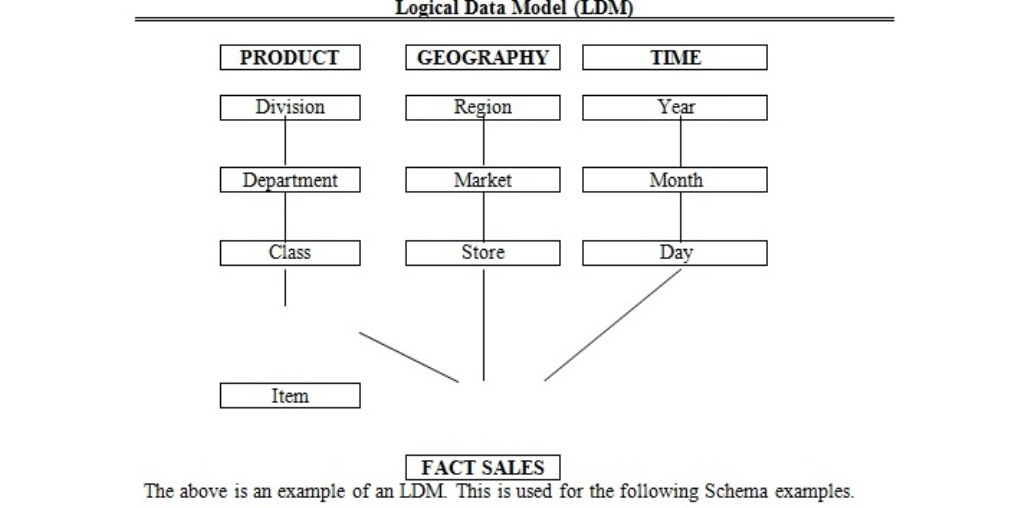
Consolidated Star Schemas |
General Characteristics
·
One Table for One Dimension
·
Every Dimension will have a Generic Key
·
Every Dimension will have a Level
Fact
Table Types
·
Consolidated (Class in the above eg.)
·
Atomic data only (Item in the above eg.)
Consolidated
·
Most common fact table structure
·
Fact tables contain base table data as well as
aggregate data for every possible level of aggregation (items consolidated
into class, class into dept. etc.)
·
In table aggregation : storing aggregate data in the
same table as atomic level data. Eg. Storing Store, Market, Region level info
within the same fact table(aggregation table also available in fact table)
Atomic data only
·
Fact tables contain only one level of data per
table (lower most level only)
·
No table aggregation
|
|
Consolidated Star Schema (1)
|
Consolidated Star Schema (2)
|
Consolidated Star Schema (3)
|
|
Lookup
Tables
·
Every Dimension will have a Generic Key ID and
DESC
·
Only 1 table for 1 Dimension
·
Every Attribute will have only ID, no DESC
·
Has a LEVEL field (for easier analysis between
attributes)
·
Lowest Level of Denormalization
NOTE : LEVEL WILL HAVE TO BE INPUT
MANUALLY
Fact
Table
·
Has only one Fact Table
·
Fact Table will have ONLY KEYS, not Ids
·
No LEVELS in Fact Table
Advantages
Disadvantages
·
Unable to display multiple attribute descriptions from the same dimension on the
same report
·
Extra
processing outside
of the database may be required to produce the desired report
·
Because there is only one desc. Column in the
dimension table, to get desired reports, additional
self-joins would be reqd which can be a costly affair
|
Lookup
Tables
·
Every Dimension will have a Generic Key ID only
·
Only 1 table for 1 Dimension
·
Every Attribute will have only DESC, no ID
·
Has a LEVEL field (for easier analysis between
attributes)
NOTE : LEVEL WILL HAVE TO BE INPUT
MANUALLY
Fact
Table
·
Has only one Fact Table
·
Fact Table will have ONLY KEYS, not Ids
·
No LEVELS in Fact Table
Advantages
·
Able to display multiple attribute descriptions from the same dimension on the
same report
Disadvantages
·
Only attribute desc is there. Querying can be only
on characters, so query takes more
time (querying on numeric fields is faster)
|
Lookup
Tables
·
Every Dimension will have a Generic Key ID only
·
Only 1 table for 1 Dimension
·
Every Attribute will have both ID and DESC
·
Has a LEVEL field (for easier analysis between
attributes)
·
Highest level of Denormalization
NOTE : LEVEL WILL HAVE TO BE INPUT
MANUALLY
Fact
Table
·
Has only one Fact Table
·
Fact Table will have ONLY KEYS, not Ids
·
No LEVELS in Fact Table
Advantages
·
Combines (1) and (2), hence eliminates
disadvantages of the two
·
Disadvantages
|
Normalized Star Schema |
|
Fact
Tables
·
Only store one level of fact data per table
·
Never any table aggregation
·
Aggregate tables(and atomic level tables) contain
the attribute ID of the attribute for which the table holds data
Sparsely
Aggregated vs. Densely Aggregated Schemas
Consolidation at higher
attributes - Densely Aggregated
Consolidation at lower/lower-most attributes(few
aggrn. tables) - Sparsely Aggregated
Normalized
Schema is mostly used and preferred because it allows many to many
relationships
|
|
Normalized Star Schema (1)
|
Normalized Star Schema (2)
MOST PREFERRED
|
Normalized Star Schema (3)
|
|
Lookup
Tables
·
has unique attribute ID and DESC
·
CHILD table will have Immediate PARENT ID (as
foreign key) only
Fact
Tables
·
Contains only one level of data
·
Only Atomic Level Ids are taken in the fact table
FACT TABLE SAME IN 1,2,3
·
IN THIRD NORMAL FORM
·
Minimal Storage
·
Additional Table Joins reqd.
|
Lookup
Tables
·
has unique attribute ID and DESC
·
CHILD table will have GRAND PARENT ID and PARENT
ID
Fact
Tables
·
Contains only one level of data
·
Only Atomic Level IDs are taken in the fact table
FACT TABLE SAME IN 1,2,3
·
Denormalized ID
·
Redundant Storage but reduces no. of joins
necessary to relate child to grandparent relationship
·
Additional table joins reqd. to present parent and
child relationship on reports
It is most preferred because of
·
Optimum Storage
·
Optimum performance
·
Query is faster because of aggregation. In the
aggregated table, we have a preset of a set of total values
|
Lookup
Tables
·
has unique attribute ID
·
has attribute DESC
CHILD table will have GRAND PARENT ID
& DESC and PARENT ID & DESC
Fact
Tables
·
Contains only one level of data
·
Only Atomic Level Ids are taken in the fact table
FACT TABLE SAME IN 1,2,3
·
Denormalized ID and DESC
·
Requires most amount of storage but eliminates
need to query more than one attribute table per dimension, to display
multiple attributes on the same report
|
|
Consolidated Star Schema
(Star Schema)
|
Normalized Star Schema
(Snowflake Schema)
|
|
·
Small No. of tables
·
Easy to understand
·
Easy to write SQL (fewer joins)
·
Level concept present
·
Supports only 1:M relationships, not M:M
relationships
·
Fact table not scalable with 'In table'
aggregation. Only one aggregation table
·
Lookup tables not scalable, as number of
attributes within a dimension increases as well as no. elements within each
attribute
·
Lookup tables are larger
|
·
More no. of tables (incl. Lookup tables) - query,
performance slower
·
More complicated schema (Grand parent, Parent
etc.)
·
Harder to write SQL (many joins)
·
No level concept
·
Supports M:M relationships
·
Aggregate data stored in separate aggregation
tables (faster access and easy to maintain). This is preferred when a Manager
wants to query by Region instead of store.
·
Flexible and scalable
·
Lookup tables are smaller but more no. of lookup
tables
|
Methodologies for creating DWs |
|
There are several methodologies used
in designing the DW models such as
·
Entity Relationship Model
·
Star Schema
·
Snowflake Schema
·
Persistent Multi-dimensional Stores
·
Summary tables
The two most popular methods of
designing the DW physical models are
·
Star Schema and
·
Snowflake Schema
|
Differences between Star Schema and Snow Flake Schema |
|
STAR SCHEMA
|
SNOW FLAKE SCHEMA
|
|
·
One Fact (Major) table and many
Dimension (Minor) Tables
·
Appearance of a Star, with the major table in the
center and dimension tables connected to it by radial lines
·
The Fact table stores the Primary Key for all
Dimensional tables
·
Eg. If Sales is a Fact Table, Customer, Product,
Time and Store are dimensions
·
Easy to define, reduces the no. of physical joins
and provides simple metadata
·
Star Schemas are best used in where aggregation
queries are not involved
|
·
Has Normalized Dimension tables, by attribute
level
·
Each smaller dimension table points to an
appropriate aggregated Fact table
·
Each Dimension table has one key for each level of
dimension's hierarchy.
·
he lowest level, for eg. The Store key of Store
dimension will join the Store Fact table, which will also have Product and
Time keys
·
Slightly more complicated. A practical way is to
start with a Star Schema and create Snowflakes with queries.
·
Snowflake Schemas provide best performance when
queries involve aggregation
|
Important Target Industries |
|
Banking
and Finance, Retail, Telecom and FMCG are in the forefront of using DW
technology because they are already in a highly competitive environment.
Typically, DW is seen as a need in markets where it is not the product but
the customer who decides the volume and the market in these segments, and
where geography and time are not constraining entities.
Petroleum/derivatives, shipping and
transport, power, metals manufacturing and fabrication have implemented data
Marts.
|
Increasing use of Business Intelligence |
|
Among the largest solutions segments
where business intelligence is being used are
·
Customer Relationship Management
·
Cross selling and effective promotion/campaign
management
·
Fraud and delinquency detection
·
Financial and Sales Analysis and Forecasting
·
Supply Chain Management
·
Human Resource management
|
|
Long Term
benefits of a DW
|
|
·
Standardization of data across the organization
and improvement in transaction systems by removing inconsistency
·
A single repository of market survey data - that
spans across time and product groups
can be built
·
Quick and Flexible reporting
·
Better monitoring of brand performance in terms of
market shares, percentage growth
·
An integrated data source for ad hoc querying and
reporting
·
Direct access of decision makers to relevant
business information
·
Continuos feedback to Planners and Management
about deviation from plans
|
Typical Problems in implementation |
|
·
Non availability/wide disparity of data, being on
different hardware platforms and operating systems
·
Very often. Data is 'unclean' and thus extraction,
transformation and cleansing of data becomes a challenge
·
Non availability of customer audit data
|